Hyperliquid's rally stalls as traders weigh next move after $44 resistance
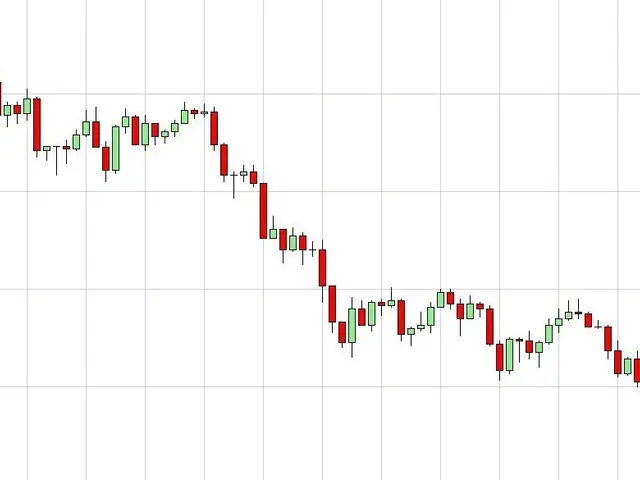
Hyperliquid’s price is testing the strength of its recent upward trend. After a strong multi-week rally, the asset has entered a phase of stabilisation. Traders are now watching whether the momentum can hold or if further cooling lies ahead. The recovery phase for Hyperliquid began in March, following a period of sharp gains. Since then, the price has climbed but now faces resistance. Sellers have repeatedly pushed back around the $44 to $46 range, preventing a clear breakout.
The asset currently sits between $40 and $41, still above its mid-term moving averages. While momentum has weakened, it has not collapsed—suggesting a gradual slowdown rather than a sharp reversal. Net flows have shifted, pointing to a volatile environment with high leverage in play.
Retail traders appear slightly more inclined toward short positions on certain exchanges. At the same time, both long and short liquidations are occurring, reinforcing the idea of a transitional market phase. Hyperliquid remains above key support levels despite recent hesitation. The mix of liquidations and shifting net flows highlights uncertainty in the short term. For now, the price continues to test whether its rising trendline can hold under pressure.

