Rush Street Interactive's wild stock ride reveals trading's highs and lows
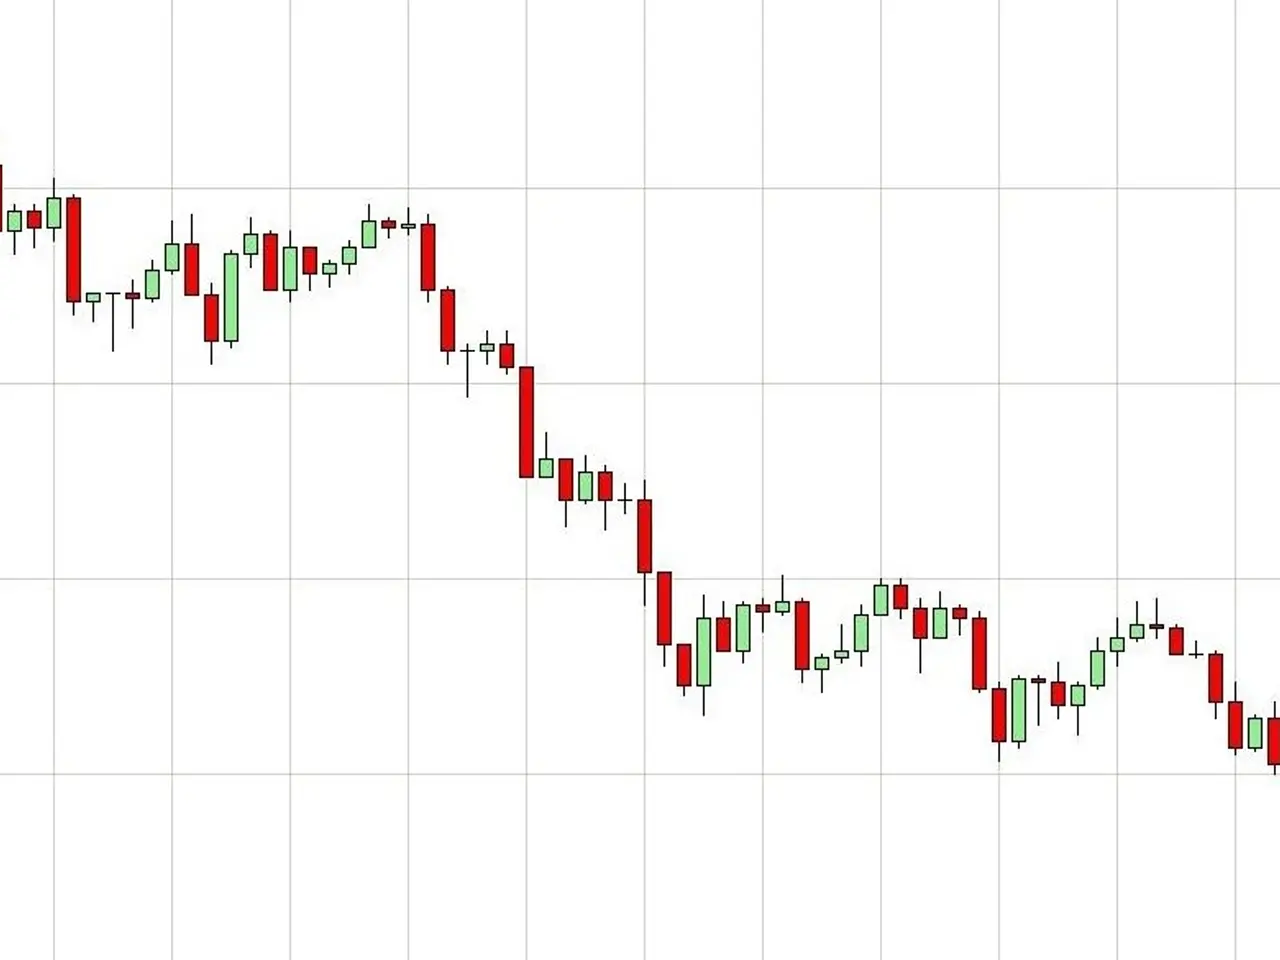
Rush Street Interactive’s stock has seen sharp swings since its April debut. Initially struggling, the shares later surged to new highs before traders began locking in profits. The movement highlights both the risks and rewards of short-term trading strategies. When the company’s shares first listed in April, they faced early pressure. A stop-loss was set at $20.41 on April 5, capping potential losses. By the time earnings were released, the stock had recovered enough to hit its first target of $26.55.
The upward trend continued, pushing the price to a second target of $28.60. At its peak, the stock climbed as high as $29 intraday. Traders who exited at the second target could have secured gains of 2.35 times their initial risk. The trade’s risk was tightly controlled, limited to just under 11% with a stop-loss at $20.20. While tight stops often get triggered, they help manage exposure. The aim in such trades is usually to earn at least three times the risk taken—a goal achieved in this case.
The stock’s volatility provided clear opportunities for profit-taking. Those who followed the strategy saw returns exceeding twice their initial stake. Meanwhile, the trade’s structure demonstrates how disciplined risk management can turn short-term moves into measurable gains.


