U.S. stock markets reveal sharp divides as S&P 500 climbs 31.5% in a year
I read about two conflicting signals in the markets this morning. One was very positive, while the other was entirely pessimistic. As I sat drinking my coffee at my local Starbucks, I pondered what I should write about today.
It's Wednesday, so I typically discuss a stock that hit a new 52-week high or low based on the previous day's action. Yesterday, there were 73 new 52-week highs and 21 new 52-week lows on the NYSE, and 138 new 52-week highs and 119 new 52-week lows on the Nasdaq Composite.
I've got nearly 1.5 times as many new 52-week highs as new 52-week lows to choose from. Ordinarily, I'd go with the former because of the greater choice.
However, my morning reading ritual has me thinking twice about doing so.
The positive signal comes from Matt Cerminaro, the 'Matt' behind Chart Kid Matt, a newsletter I've become obsessed with precisely because I'm so terrible at making charts. He isn't.
Cerminaro's post from yesterday discussed how earnings are strong, which justifies the S&P 500's 31.5% gain over the past year.
He makes a convincing argument.
The negative signal was a Fortune article from the weekend discussing the Buffett Indicator -- Warren Buffett coined the term in a December 2001 Fortune article -- which is defined as the total value of U.S. equities as a percentage of America's GDP.
Buffett suggested that you would make money over the long haul if you bought when the indicator was between 70% and 80%, meaning equities were undervalued.
The Buffett Indicator is currently approximately 232%, the highest it's been in 75 years or so, and more than double the long-term mean of 106%. That suggests U.S. stocks are overvalued.
What to do. What to do.
To match the conflicting signals, I'm going to select one stock from both the new 52-week highs and the new 52-week lows.
The best bet isn't so obvious. Here's why.
New 52-Week High - Hamilton Beach Brands (HBB)
Hamilton Beach Brands (HBB) is the first of two consumer discretionary stocks. The maker of small appliances hit a new 52-week high of $21.71 yesterday, the 9th new 52-week high of the past 12 months. Despite hitting a new 52-week high, its stock is up just 5.6% in the past year.
While HBB is a micro-cap stock with a market cap of just $283 million, and Tractor Supply's (TSCO) is $18.7 billion, I'm working with a smaller list of stocks hitting new 52-week lows. The important thing is that they're both consumer discretionary stocks affected by tariffs, higher input costs, inflation, etc.
It's been a long time since I've looked at HBB stock. I remember writing about it years ago, when it was part of Nacco Industries. The holding company got its start in underground coal mining but diversified into other industries in the 1980s.
In September 2012, it spun off Hyster-Yale (HY), a manufacturer of lift trucks for materials handling, and in October 2017, Hamilton Beach Brands. Neither stock has performed well. Nacco Industries became Nacco Natural Resources (NC) in 2021.
So, while HBB stock is up less than 6% over the past year, it has gained 71% since hitting a 52-week low of $12.72 on Aug. 15, 2025. However, its share price is well off its all-time high of $41.00, reached just days after going public.
Can it get back there?
Well, I don't know if it can double anytime soon, but it's a 100% Buy according to the our website Technical Opinion, which means, at least in the near-term, it should keep nudging higher.
The stock has no analysts covering it, so you'll have to do your own due diligence.
Looking at the 2025 results, revenues were $606.9 million, 7.3% lower than in 2024. On the bottom line, it earned $1.95 a share last year, 11.4% down from 2024. Neither number is anything to write home about.
In 2025, it returned $15.4 million to shareholders through dividends (42%) and share repurchases (58%). It last increased its dividend with the June 2025 payment, raising the annual rate to $0.48, a current yield of 2.3%, about double the average yield for the S&P 500.
One big positive: Its Altman Z-Score -- this is a formula used to evaluate the likelihood of a company filing for bankruptcy protection in the next 24 months -- is 3.51, one of the highest it's been since going public in 2017. Anything above 1.81 is considered to be non-distressed.
The company expects cash flow from operations to improve in 2026 to $40 million at the midpoint of its guidance, up from $13.8 million in 2025.
While not great, it's an improvement over 2025, when tariffs hurt its business.
New 52-Week Low - Tractor Supply (TSCO)
Tractor Supply used to be one of my favorite specialty retailers. For so long, it could do no wrong. Recently, it's hit a rough patch.
That's seen its stock fall 29% over the past year. As a result, it hit a new 52-week low of $35.26 yesterday, its 20th in the past 12 months. It's now less than $2 away from hitting a 5th new 5-year low.
The good news? It's up nearly 257% since hitting a new 10-year low of $9.97 on July 1, 2017. The bad news? TSCO stock is well down from its July 1, 2025, all-time high of $63.99.
Can it get back there? Maybe.
Analysts mostly like it. Of the 29 covering TSCO, 16 rate it a Buy (4.07 out of 5), with a target price of $48.26, about 37% above its current price.
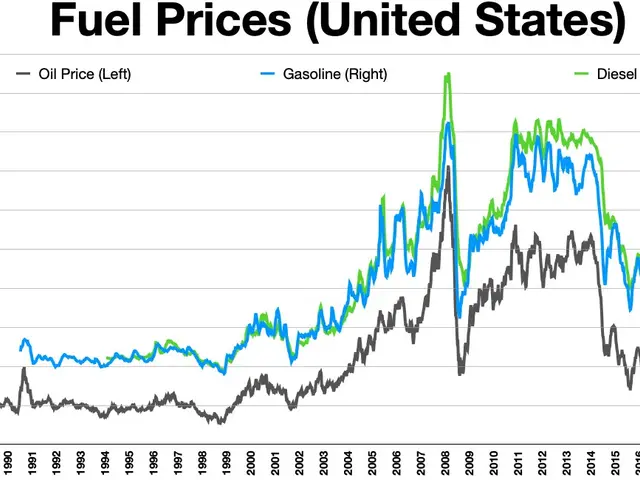
To understand the state of its current business, which faces headwinds from ongoing inflation and higher fuel prices, I'll look at its 2015 performance, when its operating margin was higher than at any time in its 32 years as a public company.
In 2015, Tractor Supply reported an operating profit of $650.5 million on $6.23 billion in sales, for an operating margin of 10.4%. In 2025, its operating profit was $1.47 billion on $15.52 billion in sales, for an operating margin of 9.5%, 90 basis points lower than in 2015.
That's not a big difference.
In terms of same-store sales growth, they increased by 3.1% in 2015, 190 basis points higher than in 2025. Net sales in 2015 grew 9.0%, driven by same-store sales growth and sales from the opening of 114 new stores. That compares to 4.3% sales growth in 2025, driven by same-store sales growth and sales from the opening of 99 new stores.
From the above paragraph, I conclude two things: 1) Tractor Supply is still opening stores at a decent clip, and 2) its customers today, excluding inflation, are still doing plenty of buying.
Based on annual sales and total selling square footage,
the sales per square foot in 2015 and 2025 were $260.11 and $380.82, respectively. The average annual inflation rate over the decade from 2015 to 2025, according to Statista, was 2.73%. That's $340.51 in sales per square foot in 2025, below the actual number of $380.82.
So, what is going on here?
Tractor Supply's selling prices over the last decade have gradually increased, accounting for much of the company's sales growth. The $40.31 per-square-foot gap [$380.82 - $340.51], which is just me spitballing, is the actual annual sales growth per square foot of 1.45%.
As long as that stays positive, the next decade should see TSCO stock appreciate considerably.
My best guess is that a contraction in TSCO's valuation multiples in recent quarters has hurt its stock. Its Q1 2026 report, released on April 21, didn't help. It missed on both the top and bottom lines.
The biggest concern shareholders should have isn't the 0.5% same-sales growth, but rather the slower pet sales, which account for about one-quarter of its overall revenue.
Historically, Tractor Supply's been good at adapting to market conditions. The latest headwinds around pet food concerns should get sorted.
Trading at or near its lowest level in five years, TSCO is the better bet despite heading in the wrong direction compared to HBB.
On the date of publication, Will Ashworth did not have (either directly or indirectly) positions in any of the securities mentioned in this article. All information and data in this article is solely for informational purposes. For more information please view the our website Disclosure Policy here.

