U.S. Stock Market Nears Bubble Territory as AI-Driven Valuations Soar
The U.S. stock market is showing signs of overheating, with valuations reaching levels rarely seen in the past 40 years. The S&P 500, widely regarded as the best measure of American equities, has held a forward price-to-earnings (P/E) ratio above 22 since July 2025—far higher than its 10-year average of 18.8. Regulators and analysts are now urging caution as historical patterns suggest this could lead to a sharp downturn.
The Federal Reserve has already signalled concerns, warning that U.S. stock prices appear highly valued. Credit markets are also flashing warning signs, with spreads between investment-grade corporate bonds and U.S. Treasuries dropping to just 71 basis points in late January—the tightest since the dot-com bubble in 1998. When credit spreads widen, borrowing costs for companies rise, squeezing profits and often triggering stock declines.
Since early 2023, the AI boom has driven extreme valuations in key S&P 500 stocks. Nvidia's P/E ratio surged from around 30 to over 70, while its market capitalisation grew by more than 1,000% to roughly $3 trillion by February 2026. Broadcom and AMD have seen similar spikes. These trends mirror the late 1990s, when tech giants like Cisco and Qualcomm traded at P/E ratios above 100 before crashing by 70–90% between 2000 and 2002. While the current AI-driven rally appears more diversified and profitable, the parallels remain striking.
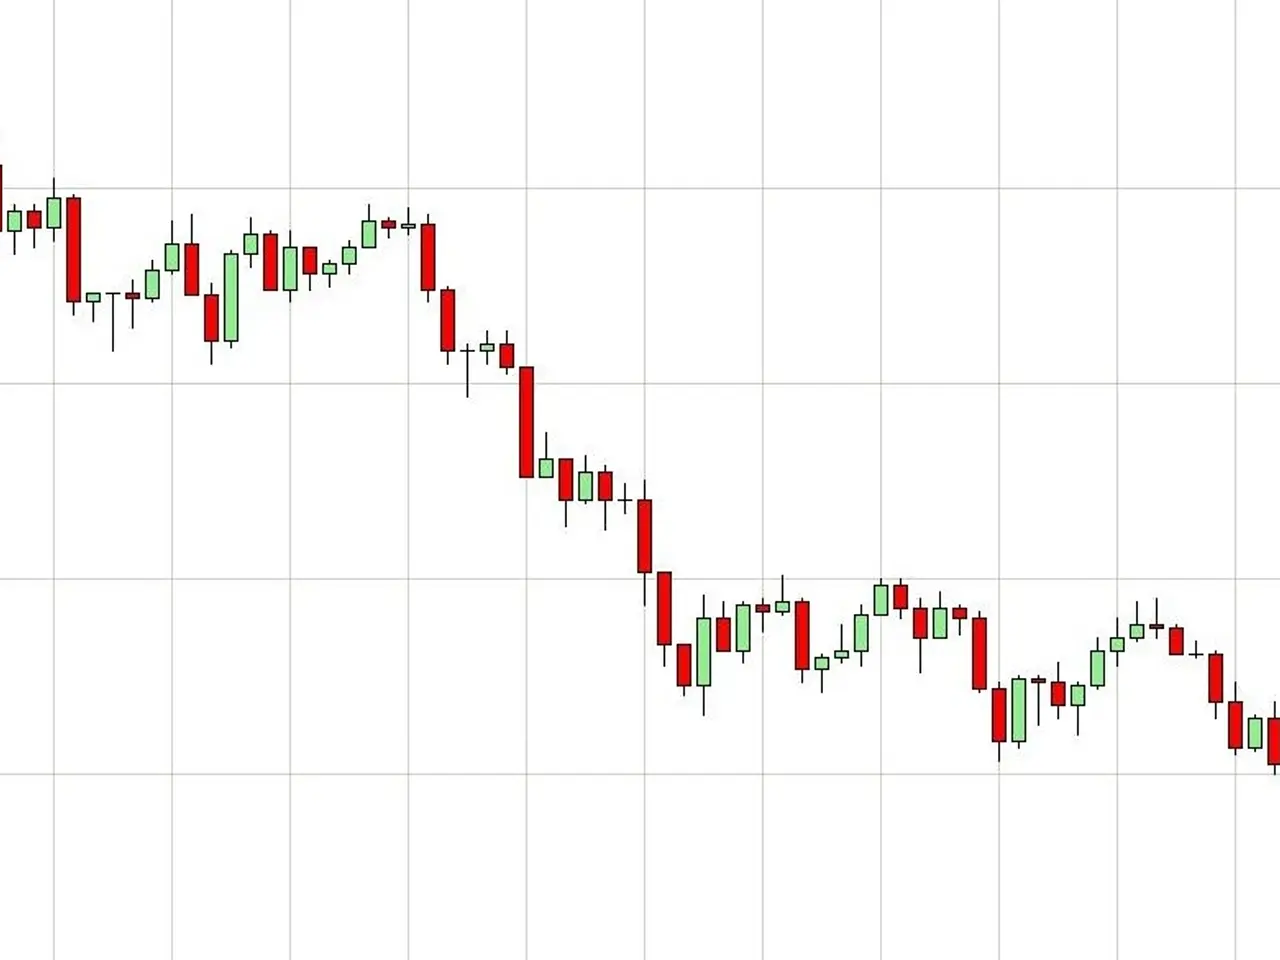
History shows that prolonged periods of elevated P/E ratios often precede bear markets. The S&P 500's forward P/E first exceeded 22 in 1998, peaking above 24 in 1999 before a 49% collapse by late 2002. A similar pattern emerged in 2020, when the ratio climbed above 23, only for the index to drop 25% by late 2022. This year, the S&P 500 has also underperformed global markets (excluding U.S. stocks) by its widest margin since 1995, adding to concerns about its sustainability.
The combination of stretched valuations, tight credit conditions, and historical precedents suggests investors may face significant risks ahead. If economic conditions weaken and borrowing costs rise, corporate profits could shrink, potentially leading to a steep market correction. The current environment closely resembles past bubbles, where high-flying stocks eventually suffered dramatic declines.

