Chainlink's LINK token crashes 22%—is this a bottom or deeper correction?
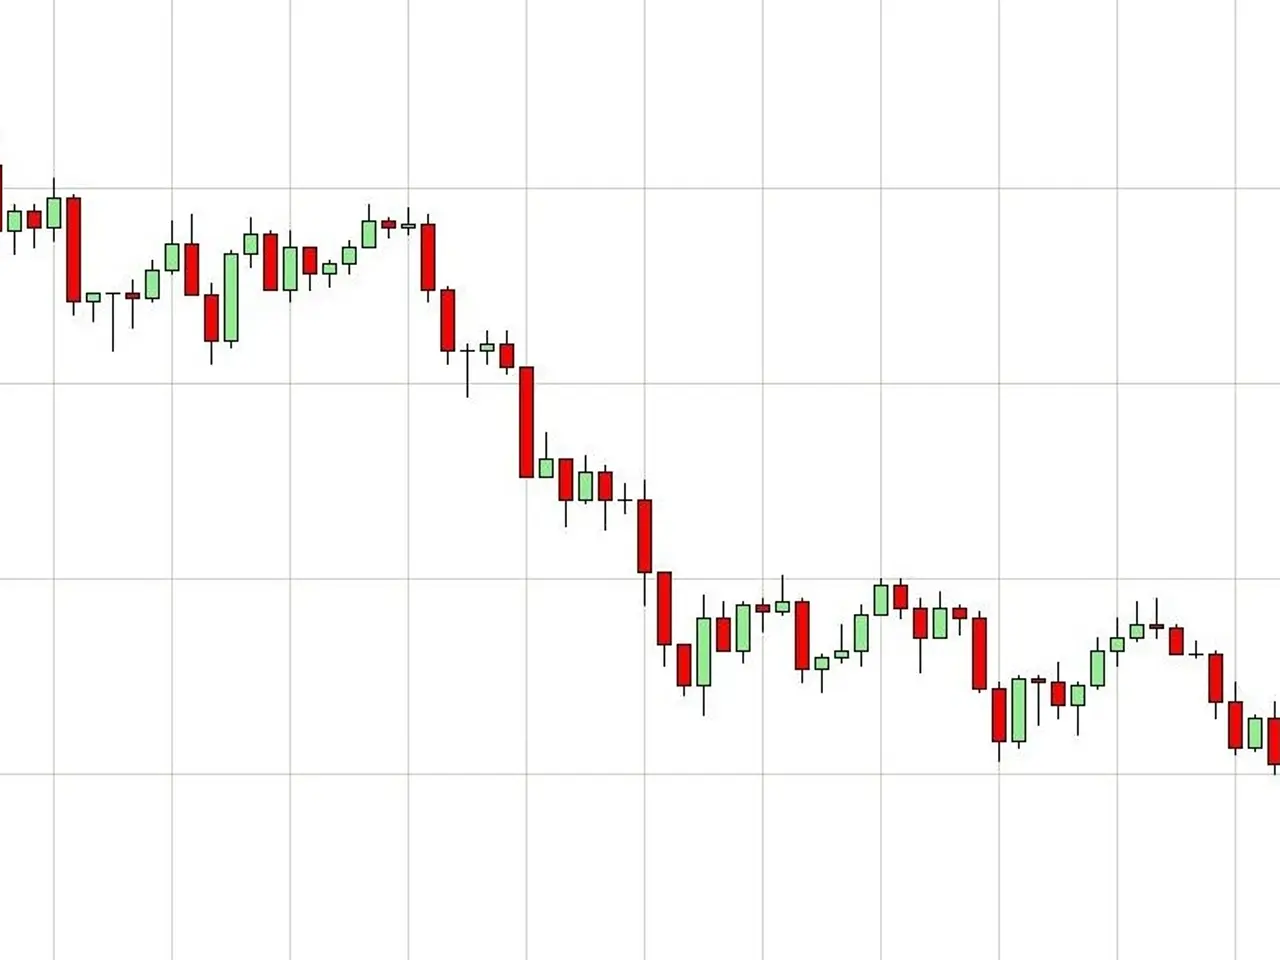
Chainlink's LINK token experienced a sharp 22% drop in late January 2026, ending a months-long upward trend. The decline occurred as Bitcoin also fell below $85,000, dragging down broader crypto markets. Despite the sell-off, some traders saw signs of potential recovery ahead.
The price of LINK had climbed steadily from around £10-11 in November 2025 to roughly £15 by early February 2026, marking a 40-50% rebound. This recovery followed a period of accumulation after consolidation, supported by reduced leverage in the market post-2025 liquidations. However, the late January slump broke a key support zone between £10.6 and £11.75, which had held firm since mid-November.
The drop pushed LINK's Relative Strength Index (RSI) to its lowest point since 2022. At the same time, the total supply of LINK held at a loss surged to around 400 million tokens, meaning a large portion of investors were underwater. Yet, buying pressure remained strong, as shown by an elevated Taker Buy Dominant metric.
As the price stabilised near £12, liquidity began to build in that range. Analysts noted that reclaiming a level above £11 could trigger liquidity-seeking flows and force short-covering, potentially paving the way for a return toward £13. Historically, similar spikes in underwater supply have preceded market bottoms and subsequent recoveries.
The late January sell-off left many LINK holders in losses, but signs of stabilisation near £12 offered some optimism. If the token regains the £11 mark, it may signal a shift in momentum. For now, traders continue to monitor whether the decline marks capitulation or the start of a prolonged correction.
Read also:
- India's Agriculture Minister Reviews Sector Progress Amid Heavy Rains, Crop Areas Up
- Cyprus, Kuwait Strengthen Strategic Partnership with Upcoming Ministerial Meeting
- Inspired & Paddy Power Extend Virtual Sports Partnership for UK & Ireland Retail
- South West & South East England: Check & Object to Lorry Operator Licensing Now
