7C Solar's stock surges past key resistance—can it break the downtrend?
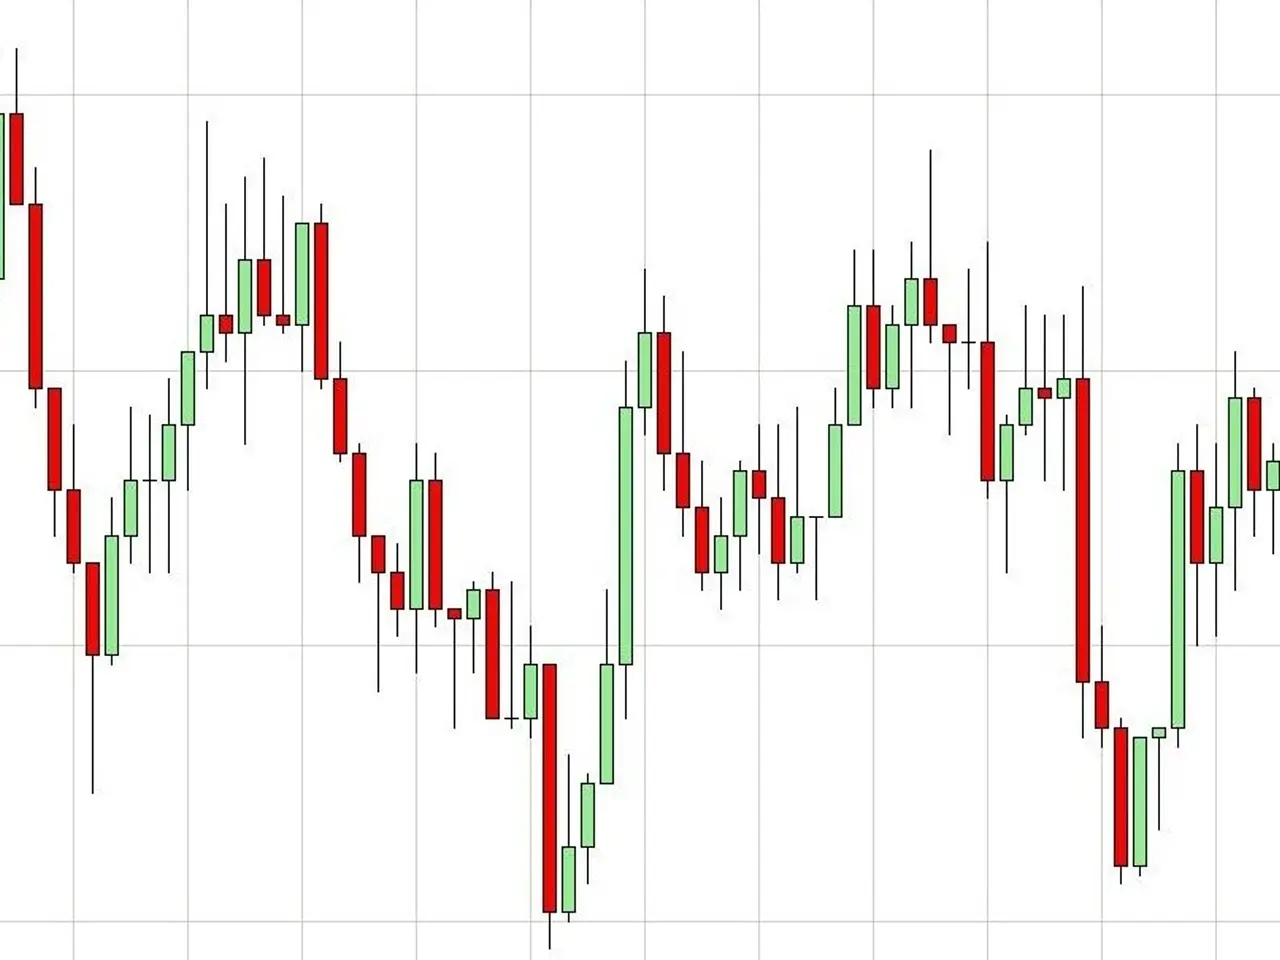
7C Solar's share price has risen above its recent monthly highs. This upward move follows a period of buying pressure that began on Friday and carried into the start of the week. Analysts are now watching whether this signals a shift in the stock's long-term trend. The stock broke above its previous trading range, clearing a key resistance level at €1.69–1.72. This area now acts as support, suggesting a possible bottom formation if the price holds. However, a sustained drop below €1.63 would call this pattern into doubt.
A further climb above €1.86–1.88 could push the share price toward €2.06–2.09. The next major resistance after that sits near the 2025 high of €2.40. Despite the recent gains, the stock remains under the influence of a long-term downtrend. Investors are also awaiting the company's 2025 annual financial report, set for release on Wednesday, April 1. The report may provide further clarity on the stock's direction amid shifting market sentiment.
The recent price action has brought 7C Solar's stock to a critical point. If it maintains levels above €1.69–1.72, the upward momentum could continue. The upcoming financial report will likely play a key role in determining whether the stock can break free from its long-term decline.


